Capturing the evolution of mountain snow in the Western U.S. using Synthetic Aperture Radar
Check out the narration of my AGU poster on this project here!
Background and Motivation
Knowledge of mountain snow is important for water supply and hazards. However, snowmelt is highly variable in time and space. Capturing this variation can improve water forecasting and knowledge of snowmelt variability over glaciers can help us improve our understanding of glacier mass balance and water delivered to the glacier bed.
Motivating question
What is the spatial and temporal variability of snowmelt timing on mountain glaciers and in mountain environments?
Methods
This work focuses on capturing the spatial and temporal variability of snowmelt timing in mountain environments using Synthetic Aperture Radar (SAR). We’ve built our analysis on scalable tools for future time series comparisons between similar mountain environments. To capture snowmelt runoff onset, we calculate the minima of a SAR backscatter time series as described in Marin et. al 2020. We estimate the spatial variability of snowmelt by calculating these minima pixel by pixel. Finally, we investigate controls of elevation and a diurnal anisotropic heating index on snowmelt timing using regression analysis.
Results
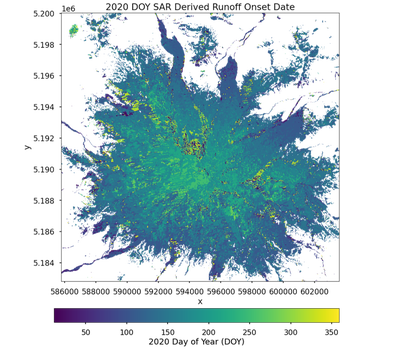
So far, we’ve identified SAR as a powerful tool for assessing the evolution of mountain snow, and with even greater potential when paired with optical data. Elevation and diurnal anisotropic heating index alone can explain 33.4% of the variance in SAR derived runoff onset dates. For every 100 meters of elevation gain, the runoff onset date at that location is predicted 4.28 days later.

Figure 1: SAR backscatter derived runoff onset day of year (DOY) estimates with vegetation masked out using a Normalized Difference Vegetation Index (NDVI) with a threshold of 0.2. The darker blues indicate a runoff date early in the year, and the bright yellows indicate a runoff date late in the year.

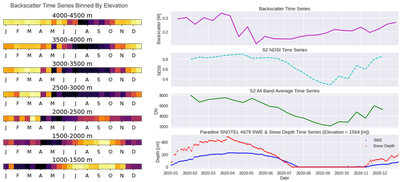
Right: Sentinel-1 SAR 𝛾0 VV polarized backscatter plotted with a Sentinel-2 Normalized Difference Snow Index (NDSI), a Sentinel-2 all band average, and daily snow depth and snow water equivalent (SWE) data from SNOTEL site #679 in Paradise, WA. Note the delay in response to snowmelt from the SAR backscatter time series compared to the optical data. Also note the coincident timing of the first decrease in SWE and the backscatter minima for the 1500-2000 meter elevation band containing the SNOTEL site.
Funding
I am supported on a NSF GRFP fellowship.

References
AGU 2020 Cryosphere session: Darychuk, S.E., et al. Snow Melt Dynamics from Satellite Observations in the Lajoie Basin, British Columbia
Marin, C., Bertoldi, G., Premier, V., Callegari, M., Brida, C., Hürkamp, K., Tschiersch, J., Zebisch, M., & Notarnicola, C. (2020). Use of Sentinel-1 radar observations to evaluate snowmelt dynamics in alpine regions. The Cryosphere, 14(3), 935–956. https://doi.org/10.5194/tc-14-935-2020
Cristea, N. C., Breckheimer, I., Raleigh, M. S., HilleRisLambers, J., & Lundquist, J. D. (2017). An evaluation of terrain-based downscaling of fractional snow covered area data sets based on LiDAR-derived snow data and orthoimagery. Water Resources Research, 53(8), 6802–6820. https://doi.org/10.1002/2017WR020799